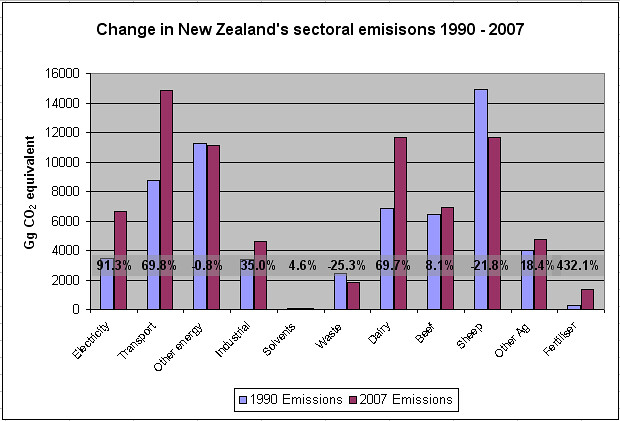
Over on Frogblog, Frog draws attention to the dodgy graphs used by Nick Smith in his consultation meetings, designed to mask one of the real areas of growth in our emissions: the dairy industry. They ask for disaggregated data, similar to that already provide don a sector level, which shows both the absolute and percentage growth for the farm sector and allows a real comparison with electricity and transport emissions.
Ask and ye shall receive...

(Sector information from the 2007 inventory. Dairy, beef and sheep emissions computed from 1990 and 2007 CRF files, and include enteric methane (burps), methane from solid waste (cowshit) and direct nitrous oxide emissions (cowpiss). "Other energy" and "Other agriculture" categories computed by subtraction. Percentages show the percentage growth or decrease in emissions since 1990).
This shows the truth that the government wants to mask: that there has been massive growth in the dairy industry, that it massively exceeds electricity-sector emissions, and that its rate of growth is the same as that of the transport sector. Dairy cows are among our worst polluters. And it is time we stopped subsidising them and forced them to pay their own way.