Showing posts with label Wonkery. Show all posts

Friday, June 29, 2012


The policy of prescription charges

In the Budget this year, the government announced it would be raising prescription charges from $3 to $5 an item, causing serious concerns around access to healthcare. Today, in their post-Budget dump, they released the policy documents around that decision, and they tell a very ugly tale.

The idea was, of course, cooked up by Treasury, driven by a desire to cut health spending [PDF]. Their initial report on the matter, T2011/2570: Improving the Targeting of Co-payments in Primary Care [PDF], pushed for cuts in both prescription charges and subsidised doctor's visits. However, that paper also noted the potential downsides - that it could decrease use of health services, and that this could increase costs elsewhere (for example, if people stop getting their statins or asthma inhalers and instead end up in hospital). it presented two options: an increase to $5 and to $10, with savings of $45 - $50 and $160 - $170 million a year respectively. In a subsequent paper on Savings Options in Health [PDF] they pushed for an even higher increase, to $15 or $20. Their estimated savings for these options "assume no behavioural impacts i.e. no reduction in prescription volumes", but presented such a drop largely as a saving due to reduced pharmaceutical costs, offset marginally by greater subsidies to high-volume users.

That's right: in Treasury-land doubling or tripling the price of something, or even increasing it sixfold does not reduce demand. Which is some very interesting (but convenient, in that it lets them completely ignore the obvious negative consequences) economics.

(There's a more explicit version of Treasury's methodology here [PDF]: take the number of prescriptions last year, multiply by the cost increase, and that's the "saving". Given that the primary purpose of increased charges is to influence behaviour, this suggests that they are either being highly dishonest, or do not believe in the supposed benefits of their own policy).

In April, Treasury recommended [PDF] an increase to "the lesser of $10 or the cost to the pharmacy for each prescription item", with reduced exemptions. The health budget could then be cut by $50 to $75 million "to return the savings to the centre". It seems to have taken some "Free and Frank advice on increasing the pharmaceuticals co-payment" [PDF] on the problems of such a system (both implementation difficulties, and the negative side-effects) to talk them out of it.

So, it looks like we got off lightly. But like rust, Treasury never sleeps; I'm sure they'll be back pushing for an even greater increase next year.

Tuesday, March 16, 2010


How much is it all worth?

For the past six months, the government has been threatening to dig up our national parks. They justify this by arguing that New Zealand has immense mineral wealth - supposedly as much as Australia - but its all kept "off limits" due to conservation laws. But as Gordon Campbell points out, their preferred figure - $140 billion - is a "back of the envelope" estimate from a mining lobbyist. If you trust that figure, I have a beehive-shaped building in Wellington to sell you.

So how much is it really worth then? Back in 2002, Statistics New Zealand began work on preparing a system of natural resource accounts [PDF] in order to better measure the sustainability of the New Zealand economy. Part of this involved generating a monetary and physical stock account for minerals [PDF]. This used an internationally accepted methodology based on the NPV of resource rental (the same methodology used by mining companies in making their economic decisions), and covered all major minerals currently economically extracted in New Zealand - gold, silver, iron, aggregate, and others. Minerals not currently or recently extracted could not be valued, as there was no way of calculating resource rental for them. A similar exercise was conducted for energy resources [PDF], including coal and petroleum. Combining the two - minerals plus non-renewable energy resources - gives a total figure (for 2000) of NZ$3,683.2 million. Quite a difference from $140 billion, isn't it?

A couple of caveats. First, as will be apparent if you look at the tables, these figures vary depending on market prices. Historically, the value for minerals has varied between $100 million and $1 billion, that for petroleum and coal between $1.6 and $5.5 billion. 2000 was a bad year for minerals but a good year for oil. But even if we take the maximum values for each, we're still looking at $6.5 billion - around 20 times lower than the government suggests. Second, these figures are ten years old - sadly, Statistics New Zealand doesn't seem to have continued the project. But they're at least a ballpark indication, and they show that the ballpark is somewhere vastly different from where National puts it.

In short, National's quest to dig up our natural heritage is based on poor numbers and mining industry hype. And whichever side of the fence you're on, that's a very poor basis for a decision.

Friday, May 23, 2008


Climate change: is it enough?

Last night, I hacked the government's ETS allocation plan out of Budget data, revealing that over the initial phase of the ETS, they planned to allocate 100 MTCO2-e to sectors projected to emit 105 MTCO2-e. The obvious question which flows from this is "is it enough"?

The obvious answer is "no". Our Kyoto target is to reduce emissions to 1990-levels on average. At current projections, we're expected to exceed this by 22 MTCO2-e over CP1. So that's the amount we need to underallocate by. Anything more, and we're committing to having to buy credits on the international market. The problem is, we've started late (we really should have done this back in 2002, which was when it was originally expected to be implemented), and with the scheme being progressively introduced and initially excluding our worst polluters - farmers - there are serious equity issues in asking those sectors which enter early to bear the whole burden of emissions reduction. The initial goal should be to get the scheme up and running and get that carbon price into the economy; once that's done then we can progressively lower the cap to reduce emissions.

(And that said, the government should keep a close eye on things over the next few years and take the opportunity if it can to push things a little further. If for example the scheme seems to be succeeding or high oil prices reduce transport emissions, it should preserve those gains by reducing the allocation proportionately in later years. Though I suspect the lag time involved here will make that difficult).

The real potential for emissions reductions will happen after 2013, when all sectors are part of the scheme. The equity argument disappears then, and so the government can just start lowering the cap to force reductions.

As for what the cap will be then, the Budget and the net position again give some guidance. The Budget allocates ~23.5 MTCO2-e in 2011 and 2012 to cover the sectors which are part of the ETS at that stage (note that this is significantly less than the projected demand from those sectors of 35 MTCO2-e). In addition, the agricultural sector will add around 40 MTCO2-e / year, and the waste sector around 1.5. Assuming they allocate enough to cover the latter, we're looking at around 65 MTCO2-e of credits a year against annual demand of around 76.5 MTCO2-e. This is still higher than 1990 emissions (61.9 MTCO2-e), but clearly there are going to have to be some reductions or some international trading (or some deferred deforestation; the forestry industry will receive another 33 MTCO2-e of credits to cover deforestation post-2013. I don't know what their projected demand is, but they are likely to be a source of credits for everyone else).

Again, we can ask "is this enough"? The answer this time is "maybe". In Question Time the other day the government was suggesting that post-Kyoto we could be looking at an international target of a 5% to 15% reduction on 1990 emissions by 2018. We'd likely meet the former once forests were taken into account. And if we end up with the latter, we would at least be moving pretty strongly in the right direction.

Climate change: how big is the cap?

How does emissions trading work? The textbook answer is that the government sets a cap on emissions, issues that many permits, then demands that polluters return enough to cover their emissions. Polluters trade permits amongst themselves to determine who gets the right to pollute within the cap. Pared down to the basics like this, one thing is immediately apparent: every ton of CO2-equivalent requires a permit, so the environmental effectiveness of the scheme is determined solely by the size of the cap. The lower the cap, the less carbon dioxide is emitted, and the greater the financial incentive to invest in efficiencies or simply stop polluting entirely.

The key question for New Zealand's ETS then is "how big is the cap"? In its first phase, the EU ETS made the mistake of overallocating, distributing so many permits that polluters had no need to reduce emissions and no incentive to do so. We don't want to make the same mistake as them.

Fortunately, there's a clue in the Budget. The Notes to the Forecast Financial Statements includes a note on provisions for ETS credits. This is basically a way of tracking the expenses and revenue as the government allocates credits (the loss of an asset, and hence an expense) and then has them returned (the gain of an asset, and hence revenue; I'm not sure where actual revenue from the sale of credits is booked or forecast). Divide those numbers by Treasury's current carbon price (NZ$22.18/ton, according to their latest estimate) and you get an idea of how many carbon credits the government plans to allocate. Using the "expenses" line (which is the value of credits allocated), the numbers come out like this:

  • 2009: 33.77 MTCO2-e
  • 2010: 16.05 MTCO2-e
  • 2011: 23.58 MTCO2-e
  • 2012: 23.58 MTCO2-e

For a total of ~100 MTCO2-e over CP1.

The next question is "how does this compare with demand"? Different sectors enter the ETS at different times, but the government's Net Position Report 2008: Projected balance of emissions units during the first commitment period of the Kyoto Protocol [PDF] has some details on projected emissions. Here's some rough figures:

  • Forestry: The government plans to allocate 21 MTCO2-e to cover deforestation for the whole 5 years, but the latest net position only expects the forestry sector to use 17 MTCO2-e (it can sell the rest for profit).
  • Energy (excluding transport): This enters the ETS in 2010. Projected emissions are on p42, and average 18.32 MTCO2-e a year over the period. However, that includes around 5 MTCO2-e / year of "other fuel combustion" (agricultural and forestry machinery) and fugitive emissions. The former will be included from 2011 under liquid fossil fuels, while the latter doesn't seem to be included at all. Call it 13.32 MTCO2-e a year for a nice, round number, for a total demand of ~40 MTCO2-e.
  • Industry: This enters the ETS in 2010, and projected emissions average 4.3 MTCO2-e / yr. So that's ~13 MTCO2-e over the whole period.
  • Liquid fossil fuels: This now enters the ETS in 2011, and projected emissions are 14.2 MTCO2-e / year. To that we need to add the 3.2 MTCO2-e / year of "other fuel combustion", for a total demand of ~35 MTCO2-e.

So total demand will be ~105 MTCO2-e. Which means someone is going to come up short and either have to reduce their emissions, or buy in credits from overseas to cover them. Which they do doesn't matter - a ton of carbon is a ton of carbon, and the atmosphere doesn't care where it comes from (or rather, doesn't come from); the important thing is that we're not overallocating, and that emitters are going to have to do something in order to stay within the cap.

Wednesday, May 14, 2008


Climate change: hoisting Rio-Tinto with their own petard

Yesterday saw Rio Tinto stick their hand out for corporate welfare, threatening to shut down their Tiwai Point aluminium smelter unless shielded from the effects of the emissions trading scheme. It is, of course, motivated purely by self-interest - the ETS would mean paying more for electricity, which would mean lower profits for Rio Tinto's shareholders. And it's par for the course for Rio Tinto, who made exactly the same threat just a few years ago to get government-owned Meridian Energy to cut them a cheap deal on power, and a few years before that in an effort to get the government to sell them the Manapouri power station (fortunately, they were unsuccessful). And its particularly egregious because Tiwai Point is already shielded - the ETS includes provision for companies which are "trade exposed" and adversely affected by either the cost of emissions or the cost of electricity to receive substantial amounts of carbon credits as compensation to ensure their profitability. While this shielding - essentially a subsidy from the New Zealand taxpayer to Rio Tinto's foreign shareholders - will eventually expire, by that time we expect much of the rest of the world to be part of a global climate regime (either by imposing their own carbon price, or by having it imposed for them in the form of border taxes on imports from polluter nations).

Rio Tinto's naked self-interest has naturally produced a backlash, with comments ranging from fuck 'em to fuck off. And I agree. But not just because I dislike capital acting as a "virtual senate" to veto the policy of democratically elected governments, but also because Tiwai Point is not actually economically beneficial to New Zealand. We would be better off if we simply shut it down. And the glorious thing is you can show it with Rio Tinto's own numbers.

Back in 2004, when Comalco (as it was known then) was threatening to leave New Zealand if forced to pay market rates for electricity, it produced a self-serving little report on The Continued Economic Contribution of the Tiwai Point Aluminium Smelter, 2004 – 2012 [PDF]. This assessed the smelter's aggregate economic benefit to New Zealand - including corporate taxes, employment, fixed charges, dividends from SOEs, and deferred investment in the national grid (that apparently being a "benefit") - at a grand total of $121.2 million per year. For the period 2013 to 2022 (which is the period we're talking about here), they expect a lower benefit: $103.8 million per year.

These benefits are outweighed by the benefits of shutting the plant down. How? Because as many people have noted, Tiwai Point uses around 15% of the nation's electricity - electricity that could (with a significant grid upgrade) be used elsewhere. That is more than the around 12% generated annually by coal, so the most significant advantage of such a shutdown would be that we would be able to effectively shut down the inefficient, coal-burning Huntly power station and relegate it to permanent dry-year backup. And that's where the benefit would come in, because Huntly costs us a lot of money.

According to the Ministry of Economic Development report on New Zealand Energy Greenhouse Emissions 1990 - 2006, Huntly's emissions in 2006 totalled 4.671 MTCO2 (yes, they're it for the coal column; co-gen is counted separately). Assuming a carbon price of $25/ton, that effectively cost us $116.775 million (2005 emissions were even higher). So, at current prices, it is economically worthwhile simply to let them leave, and stick the extra $10 million a year into an economic development agency for Southland. But it gets better. Remember the need for a grid upgrade? We're already doing part of it. That knocks just over $13 million off Comalco's calculated benefit (because remember, having a shitty national grid is a Good Thing in their books), increasing the benefit of their departure to $26 million per annum. So, the economically rational thing to do is call Rio Tinto's bluff, get Transpower to upgrade the Invercargill-Livingstone link, and watch them go.

This is on their own numbers, remember. They have been hoist with their own petard.

Friday, February 29, 2008


Ask and ye shall receive (if I feel like it)

Today is Leap Day, the International Day of the Frog, and in the course of suggesting how other blogs would be covering it, FrogBlog came up with this:

I expect No Right Turn to have detailed policy analysis on possible legislative action relating to the Maud Island Frog.
This was intriguing, so I thought I'd have a look at it. And it turns out there is legislative action to protect the Maud Island Frog, but its not what you think it is.

First, the Maud island Frog is one of the world's rarest frog species. Like the Tuatara, it's a living fossil, a remnant of proto-frogs from before the age of the dinosaurs:

It does not have webbed feet, but has atavistic tail-wagging muscles although it does not have a tail. The eyes are round, not slit, and there is no external eardrum. It does not go through a tadpole stage, but instead develops totally within a gelatinous capsule derived from an egg, and therefore does not need standing or running water for reproduction.
Currently almost the entire population of Maud Island Frogs - ~4000 out of less than 4500 individuals lives on (you guessed it) Maud Island, in the Marlborough Sounds (which they share with the Kakapo and Takahe). In an effort to prevent a localised environmental catastrophe from wiping out the entire species, DoC has transplanted a population on nearby Motuara Island, and more recently to the Karori Wildlife Sanctuary (where they seem to be doing well).

According to its entry in the IUCN red list, the major threats to the Maud Island Frog are habitat loss and degradation, predation and competition by introduced species, and its limited range and slow breeding cycle. The legislative framework seems to be dealing well with these threats. The frogs live in predator-free scientific or nature reserves, and as mentioned above steps are being taken to disperse and expand their population. But it also lists another threat: climate change. Climate change is killing frogs, by drying them out and allowing fungal diseases to spread. And with the Maud Island Frog restricted to such a small geographic area, they could very easily be adversely affected.

Which brings us to the legislation. Currently, the government's Climate Change (Emissions Trading and Renewable Preference) Bill is before select committee. The bill will help to reduce our greenhouse gas emissions, and so in a small way help to fight climate change and thereby protect the Maud Island Frog - a point made by Meyt in her Leap Day press release here. So, support the climate change bill; do it for the frogs.

Sunday, November 25, 2007


Unseating Prime Ministers

Much of the coverage of Howard's defeat in Australia has focussed on the fact that he has become the first Prime Minister since 1929 to lose his seat. Which immediately raises the question: has it ever happened in New Zealand? Has a serving PM ever been de-elected?

Apparently not. None of our recent Prime Ministers were (Marshall, Rowling, Muldoon, Moore and Shipley all survived in their constituencies, but were later rolled as party leader). And looking back, it seems that in the age of party politics, every defeated party leader has survived. We've had Prime Minister's resign, we've had them die in office (Ballance, Seddon, Massey and Savage), but none have ever been de-elected in this way. Which I guess just tells you that our Prime Ministers are better at finding safe seats (and keeping them safe) than Australian ones.

Tuesday, November 20, 2007


Doing things differently

One of my hobbies here is tracking the progress of private member's bills - the bills MPs get to introduce by themselves, rather than as government business. In New Zealand, the procedure for introducing a member's bill is laid out in Standing Orders 276 and 277, and is relatively simple: a new bill can be introduced any time there is space on the Order paper for it. If there are more bills than there are spaces, the Clerk holds a ballot to determine which bills will be introduced and in which order. In practice, this boils down to having a ballot the day after Member's Day (and sometimes in the weeks between as well), as necessary when spaces open up. Once introduced, bills have a fairly good chance of progression: every second sitting Wednesday is a Member's Day, and government intrudes on Member's Business at its peril. So so far we've seen a large number of member's bills voted on this Parliamentary term, with many progressing to select committee, and a handful (all from the Greens) passing into law.

In the UK, they do things rather differently.

There are two main ways of introducing a member's bill [PDF] in the UK Parliament. The first is known as the Ten Minute Rule, and allows any member to get a short debate on introducing a bill. As in New Zealand, there are always more bills than there are spaces, but where the NZ Parliament holds a ballot, the British one is very rigid: a bill can only be introduced under the Ten Minute Rule by the MP who is first to walk through the door of the Bills Office on the appropriate day. So, naturally, this being the UK, the MP's queue, and some have been known to sleep out overnight to get the valuable debate slot. Somehow, I think a ballot would be fairer.

The second method is more similar to our own, only instead of balloting for bills, the British ballot once per year for MPs, each of which then gets the chance to introduce something. As most MPs don't have a bill in mind, this leads to a scramble of lobbying as those with ideas for legislation try and persuade someone with a valuable slot on the Order Paper to take up their bill. Again, you have to wonder whether balloting bills wouldn't be fairer.

(There are also two other methods of introduction, but they're much less important).

Either way, as in New Zealand, member's bills are debated on a designated day - they have 13 Fridays a year (so slightly less time than we do). Unlike New Zealand, there are no time limits on debate, so things progress rahter slowly, and a strongly contested bill could be effectively "talked out" unless the Speaker intervenes. But I guess those are the rules they've decided to set for themselves.

I wonder how they do it in Australia?

Friday, September 28, 2007


A closer look: National on health

On Wednesday, the National Party released the first glimpse of its health policy, a discussion paper [PDF] promising "Better, Sooner, More Convenient" health care. Much of the media coverage has focused on their duplicitous decision (not mentioned anywhere in the discussion paper) to remove the cap on doctor's co-payments and leave it all to the market - a decision which would have disastrous consequences and which they are now backtracking on. But what about the rest of the policy? Is there anything actually in there?

Not really, no. While there's a lot of noise about the size of waiting lists and what a mess the health system is at the moment, National isn't actually promising much in the way of changes - they explicitly disavow reform of the DHB system, for example, and promise to retain Labour's re-universalisation of primary health care (but see above). So overall, their key policy seems to be "we'll manage it better" (with tax cuts!). Whether this is believable given their previous mismanagement (or the deceit exposed by their policy announcement) remains to be seen.

That said, they do make a few suggestions. Unfortunately, they're not exactly encouraging. On waiting lists for elective (non-urgent) surgery, they talk up a storm about how waiting lists are too long and this is unacceptable. But their "solution" - paying surgical teams a bonus for every operation completed - fundamentally misses the point. Elective surgery waiting lists are not caused by lazy surgeons or inefficient DHBs in need of "incentives" - they are caused by central government not funding enough operations to meet the demand. But National explicitly disavows any solution involving more money, saying that this would simply lead to "cost inflation" and that any gains would only be temporary. The real reason, of course, is that it is money that could be spent on tax cuts.

It's a similar situation with A&E waiting times. Again, lots of noise, but at the end of it all their key "solution" is better management. Colour me underwhelmed. What's worse is that in this case they diagnose the problems - A&E wards clog up because there are no beds in ordinary wards to discharge patients to, and because of staff shortages. These are clear capacity constraints, and the obvious answer is to increase capacity to meet them. But that's anathema to cost-shy National, who instead prefer to think they can gain efficiencies by screwing overworked medical staff even harder - just as they did in the 90's.

Much is made of greater use of the private sector, through contracting out and public-private partnerships. But overseas this policy has been a disaster, with hospitals forced to cut back on services in order to meet profit targets. The financiers get rich, but the people stay sick. But then, that's the point - as with their privatisation kick, this policy is about looting the state and funnelling public money into the private pockets of their donors and cronies, not about actually solving problems in the health sector.

Finally, there's the suggestion of offloading more work onto GPs in order to free up capacity in tertiary care. This is what PHOs are supposed to be about, and its good if those GPs have the funds and powers to provide the necessary care to their patients. But I'm somewhat warier of their suggestion for performing surgery and such in "Family Health Centres"; while seemingly about merely co-locating GPs and specialists to make access easier, the capital investment required means that these new facilities are more likely to be built, owned and operated by large medical companies. In other words, what National is talking about is devolving an increasing portion of our health services to privately-owned and profit-making mini-hospitals - privatisation by stealth.

So overall, not a particularly impressive policy, and actively bad in many of the solutions it suggests. And it raises the same question as their aged-care policy at the beginning of the month: does National have a policy which isn't about looting the state to repay its donors? Or has our main opposition party devolved completely into kleptocracy?

Wednesday, February 28, 2007


The Denialists' Deck of Cards

Abstract:

The Denalists' Deck of Cards is a humorous illustration of how libertarian policy groups use denialism. In this context, denialism is the use of rhetorical techniques and predictable tactics to erect barriers to debate and consideration of any type of reform, regardless of the facts. Giveupblog.com has identified five general tactics used by denialists: conspiracy, selectivity, the fake expert, impossible expectations, and metaphor.

The Denialists' Deck of Cards builds upon this description by providing specific examples of advocacy techniques. The point of listing denialists' arguments in this fashion is to show the rhetorical progression of groups that are not seeking a dialogue but rather an outcome. As such, this taxonomy is extremely cynical, but it is a reflection of and reaction to how poor the public policy debates in Washington have become.

Full paper here. It is more relevant to consumer-protection debates (the original Giveupblog post is better for climate change denial), but still quite funny.

(Hat tip: Crooked Timber).

Saturday, February 10, 2007


Typically misleading

DPF is up to his usual tricks again, this time with a graph of government revenue over the past six years being used as a rhetorical prop to argue for (what else?) tax cuts for the rich. But as usual, he's being more than a little misleading - and quite deliberately so.

Firstly, there is the use of nominal (dollar) figures and total crown revenue and expenditure statistics. But as I've pointed out before, this is grossly misleading. Nominal figures inflate the difference between past and present expenditure by failing to correct for inflation or GDP growth. Because of this, the proper way to compare government spending and revenue over time is as a percentage of GDP growth, rather than in nominal dollars. "Total crown" figures include not only government spending and revenue, but also every dollar earned and spent by SOEs and crown entities. As much as the right would like to pretend, growth in this statistic (or at least the SOE and Crown Entity component) is not a sign of expanding government, and it does not represent government spending which could be "returned to taxpayers" as tax cuts. Instead, it is the result of growth in government-owned businesses - which to the extent it represents an increase in the government's wealth, and in its dividend income, is something we should welcome.

(I should add that a large part in the growth in total revenue in 2006 is due to exactly this reason. In its fiscal outlook [PDF], the December 2006 Half Year Economic & Fiscal Update noted that SOEs and Crown Entities made "large investment gains, resulting from strong global equity markets and one-off gains on sale of physical assets". These amounted to about 1.3% of GDP).

So, DPF is being misleading. As a former spindoctor, it was his job to mislead, and I guess old habits die hard. But he has included some valid statistics in the form of taxation revenue as a percentage of GDP, which does show an increase, both over time, and over the last year. Does this alone prove his point?

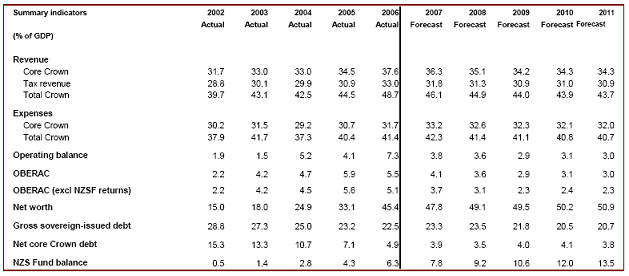
No. As the table below shows, the increase in 2006 DPF relies upon to prove his point was a one-off:

(Stolen from the December 2006 HYEFU Forecast Financial Statements [PDF])

The 2006 Budget Forecast Financial Statements [PDF] predicted 2006 tax revenue to be 31.7% of GDP. It turned out to be much higher, but is expected to decline thereafter to a long-term average of about 31% of GDP. This is an increase since 2000, but not as much as DPF makes out. Part of that increase (about 1% of GDP) is due to fiscal drag (which the government is finally moving to eliminate); the rest is due to a policy decision to make the tax system more progressive by taxing the rich more to fund public services for all - something I don't think anyone should be apologising for.

As for the source of this windfall, comparing the budget and half-yearly fiscal updates is informative. Essentially, it came about to due a far stronger economy than expected. Higher growth in wages due to the tight labour market and unions pushing for increases resulted in individual taxes being $746 million more than expected. But the real surprise is in corporate taxation: this was up by $1.36 billion - 15%! - due to strong economic growth and higher corporate profits. This won't last - corporate taxes follow the business cycle and have already returned to forecast levels, but in the meantime its a nice little windfall - and all the more startling when you remember that corporate taxes amount to on average 18% of tax revenues - compared to 48% for personal taxes.

As for DPF, when you dig into it, his argument boils down to two claims, that a) a one-off (but not enormous compared to the size of the overall budget) windfall justifies a significant permanent reduction in revenue; and b) that the rich need a tax cut because they're doing so well at the moment. Needless to say, I don't think either argument holds water. But then, I'm not a member of the National Party...

Sunday, October 29, 2006


Geeking out on milk

In response to my post on Clark on climate change, in which I suggested that farmers should be paying the cost of their emissions rather than receiving an environmental subsidy from the government, Muerk asked the obvious question: wouldn't this cause prices to rise? And could this have bad equity effects by pricing low income families out of dairy consumption?

I've just spent the last half hour geeking out trying to answer this question. Here's my quick calculations:

According to Fonterra's summary of the dairy industry, there are 3.85 million dairy cows in New Zealand, producing 14.6 billion litres of milk. So each cow produces on average 3792 L of milk.

According to the latest inventory report, each cow produces:

  • 117 kg / year of nitrogen in urine. Using the measured emissions factor of 0.01 and the standard Global Warming Potential of 310, this turns into 0.3627 T CO2-e per year of nitrous oxide.
  • 79.4 kg / year of methane from enteric fermentation, and 0.889 kg / year of methane due to shit. Using the standard emissions factor of 21, this turns into 1.686 T CO2-e per year of methane.

Added up, this is just under 2.05 T CO2-e per cow per year. The cost of those emissions varies depending on who you ask - the government says $20 / tonne, the Greens $30. Using the Greens' figure to get a high estimate, this means an additional $61.50 a year per cow. Dividing by 3792 L of milk yields an extra 1.6 cents a litre. Hardly going to break the bank, is it?

Similar calculations to find the carbon cost added to each sausage or steak are left as an exercise for the reader.